Sometimes you want to show a lot of detail about your project, and sometimes you only want to show a summary. OnePager Express lets you filter your project schedule to indicate the tasks and milestones that you want to present. This way, you can select only the parts of your project plan that are relevant to your audience. There is no limit to the number of filters you can create, which means you can create multiple reports from the same Excel spreadsheet.
Import Filters
Import filters let you pick and choose which tasks and milestones from your Excel sheet are imported into OnePager. There are two main types of import filters:
Excel Flag Field
Set up a simple "Yes/No" field in your spreadsheet. OnePager will only import the "Yes" items:

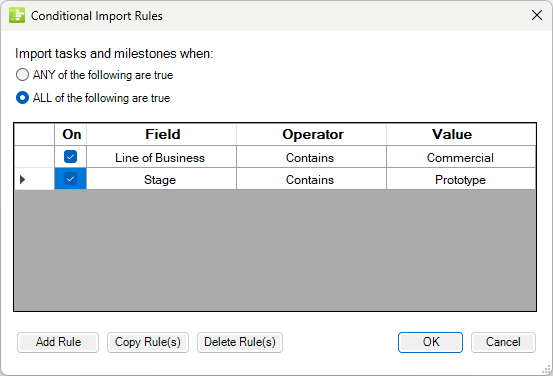
Custom Import Filters
Create a set of custom import rules that look at one several different values in your spreadsheet:
Display Filters
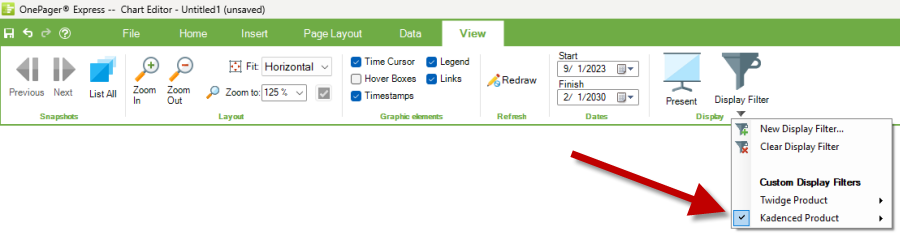
Display filters let you quickly focus your chart on a subset of tasks and milestones without needing to change what was originally imported.
For example, if you have a chart that displays the different manufacturing steps for multiple products, but you want to temporarily narrow the focus of your chart to only focus on a specific product, you can apply a display filter to hide all of the products except the one that you want to show. Once you are finished reviewing the specific product, you can clear the display filter and return to your original chart without needing to re-import anything from Excel.